This page summarizes the main electrical measurements of the Model 1955, a stereo single-ended Class-A tube amplifier based on the Mullard 3-3 circuit.
The measurements include the DC operating points, power-supply behaviour, frequency response, phase shift, harmonic distortion, linearity, input sensitivity and voltage gain. They were taken after the amplifier had been operating for one hour at an ambient temperature of approximately 25 °C.
Test conditions
Unless otherwise stated, the measurements were taken after a one-hour warm-up period at an ambient temperature of approximately 25 °C.
The amplifier was powered from a 230 V / 50 Hz mains supply. Frequency-response, distortion and sensitivity measurements were made using sine-wave test signals.
Load impedance: 8 Ω dummy load
Input signal source: audio interface Focusrite Scarlett 2i2 3rd Gen
Measurement software: ARTA software by Ivo Mateljan
Channel measured: both
Summary of key measurements
| Parameter | Measured value |
|---|---|
| Mains supply | 230 V / 50 Hz |
| Mains current draw | 245 mA |
| Apparent mains power | Approximately 56 VA |
| C9 filter capacitor voltage | 290 Vdc |
| C6 supply node | 275 Vdc |
| C3 supply node | 200 Vdc |
| Total calculated current per channel | 50.19 mA |
| Frequency response | Within approximately 2 dB from 20 Hz to 20 kHz at 0.3 W |
| Input sensitivity | 100 mV RMS at 1 kHz |
| Measured output power condition | Approximately 3.48 W |
| Total voltage gain to EL84 anode | Approximately 1320 times, or 62 dB |
Power supply and operating conditions
The measured voltage at the C9 filter capacitor is 290 V DC, compared with 310 V DC in the original reference circuit. This difference is probably caused by the internal resistance of the mains transformer used in this prototype.
A higher-voltage transformer was also tested, but it produced operating voltages that were too high. For this reason, the Hammond 370DAX was retained.
The output transformer also has a different primary winding resistance from the transformer assumed in the original Mullard 3-3 circuit. The original value is approximately:
Rp = (310 – 290) / 0.045 = 444 Ω
The measured primary resistance of the Hammond 125BSE is approximately 350 Ω. Because of this difference, R12 was changed from 3.9 kΩ to 2.2 kΩ in order to bring the EL84 plate and screen-grid voltages closer together.
Mains power consumption
The amplifier draws approximately 245 mA from a 230 V / 50 Hz mains supply. This corresponds to about 56 VA of apparent power. The real power consumption should be measured with a wattmeter if an exact value in watts is required.
DC operating conditions
| Point of measurement | Original Mullard 3-3 | Model 1955 amp |
|---|---|---|
| TR1 secondary, no load | 300 – 0 – 300 Vac | 287 – 0 – 287 Vac |
| TR1 secondary, loaded | 270 – 0 – 270 Vac | |
| TR1 filament winding | 6.3 Vac | 6.3 Vac |
| C9 | 310 Vdc | 290 Vdc |
| C6 | 290 Vdc | 275 Vdc |
| C3 | 210 Vdc | 200 Vdc |
| V2 anode | 290 Vdc | 275 Vdc |
| V2 screen grid | 290 Vdc | 275 Vdc |
| V2 cathode | 28 Vdc | 28 Vdc |
| V1 anode | 20 Vdc | 20 Vdc |
| V1 screen grid | 28 Vdc | 27 Vdc |
| V1 cathode | 17.5 mVdc |
DC currents
The following current values are based on calculations from the measured voltages.
| Point of measurement | Original Mullard 3-3 | Model 1955 amp |
|---|---|---|
| R12 | 5.13 mA | 6.82 mA |
| V2 anode | 45.08 mA | 43.37 mA |
| V2 screen grid | 4.92 mA | 6.63 mA |
| V2 cathode | 50.00 mA | 50.00 mA |
| V1 anode | 0.21 mA | 0.19 mA |
| V1 cathode | 0.21 mA | |
| Total per channel | 50.21 mA | 50.19 mA |
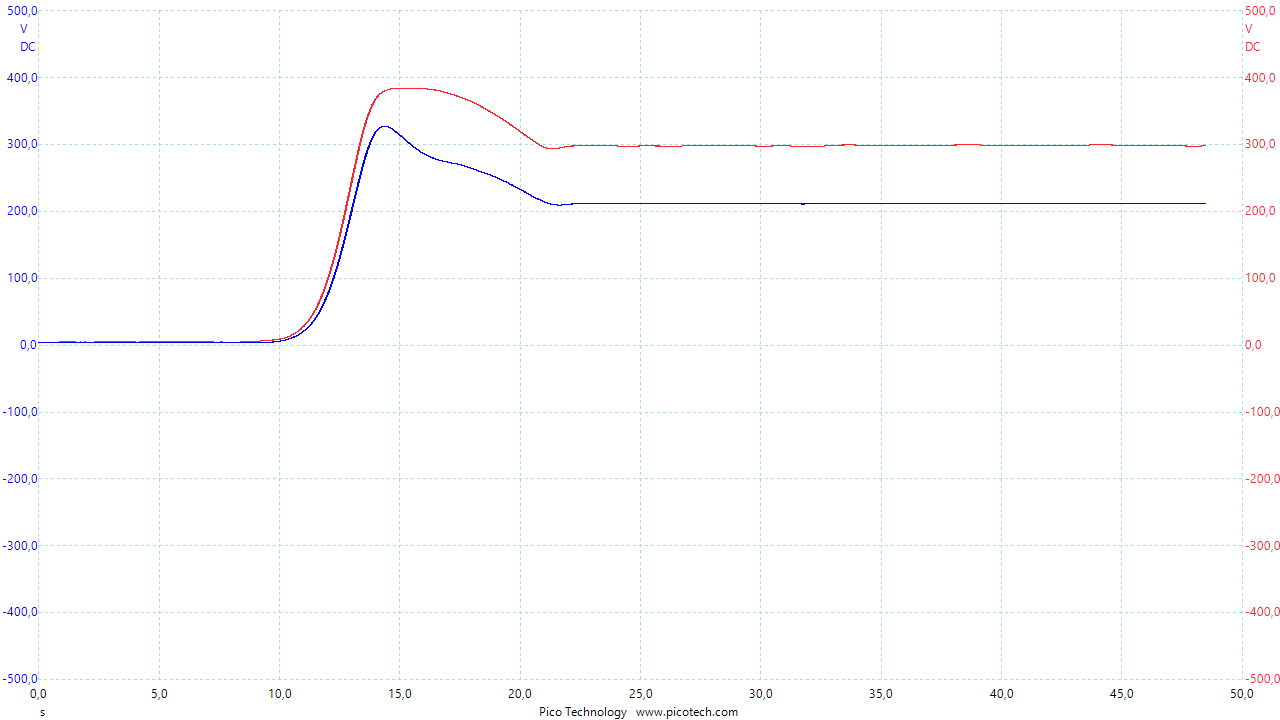
Start-up DC voltages
The start-up measurement shows the cold-start behaviour of the main power-supply nodes.
Performance measurements
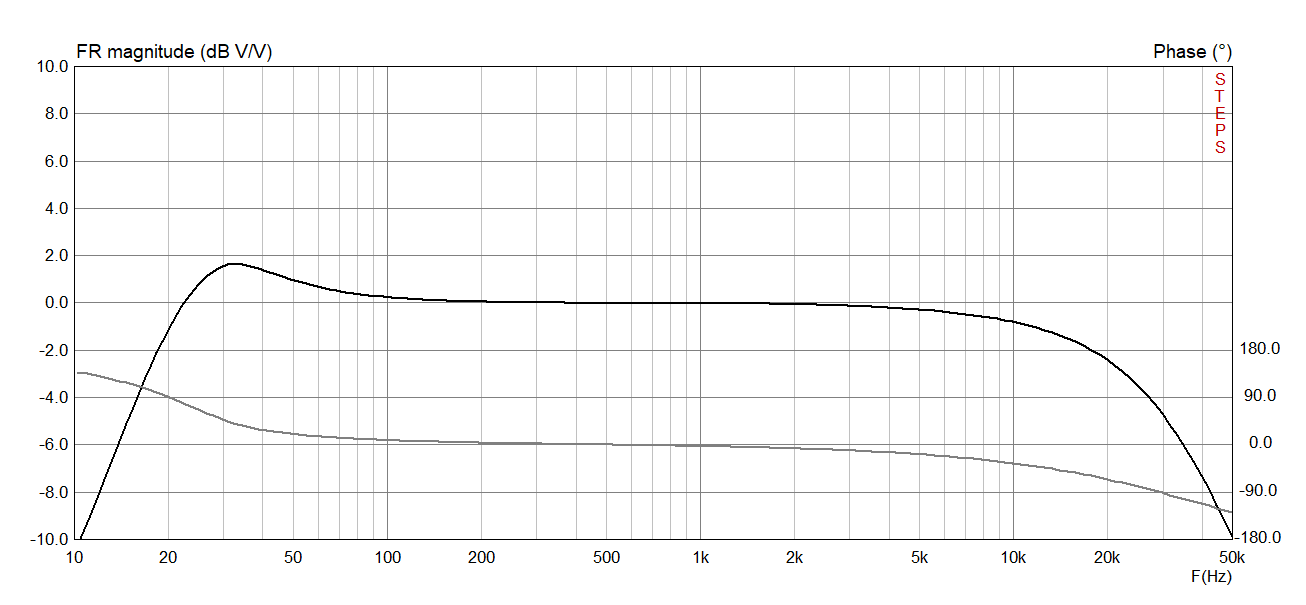
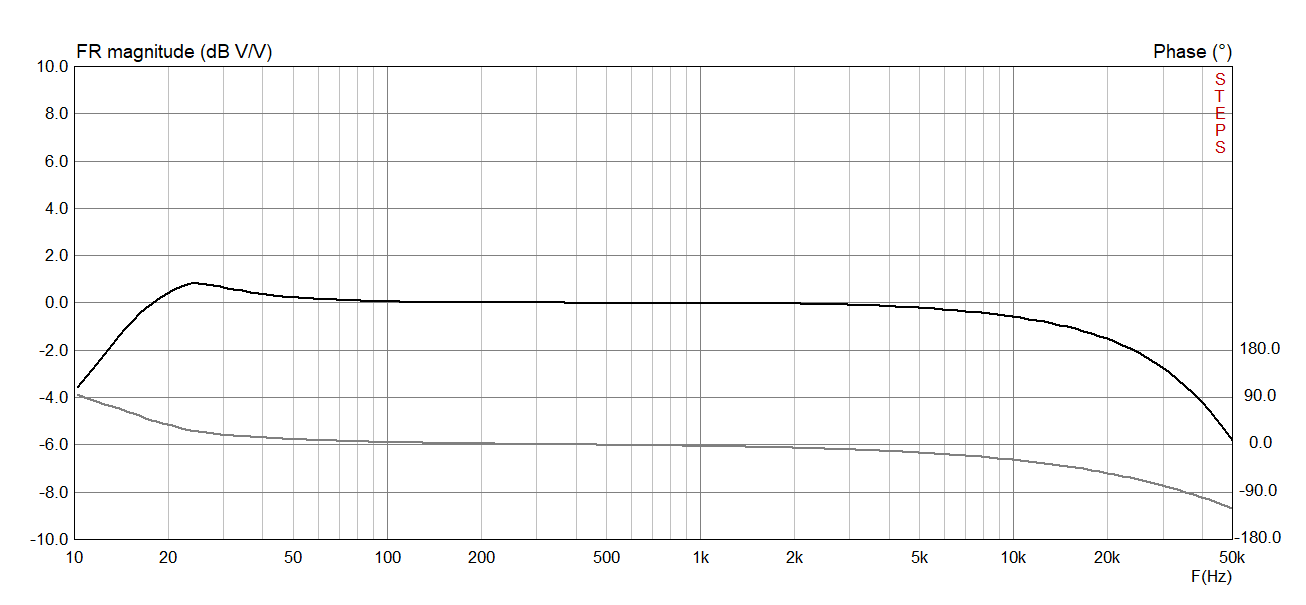
Frequency response and phase shift
The frequency-response measurements were taken at an output power of 0.3 W. The response remains within approximately 2 dB from 20 Hz to 20 kHz.
Two versions of the circuit were measured: the standard circuit and an enhanced version. In the enhanced circuit, the feedback capacitor C5 was removed and the cathode bypass capacitor C8 was increased to 100 µF.
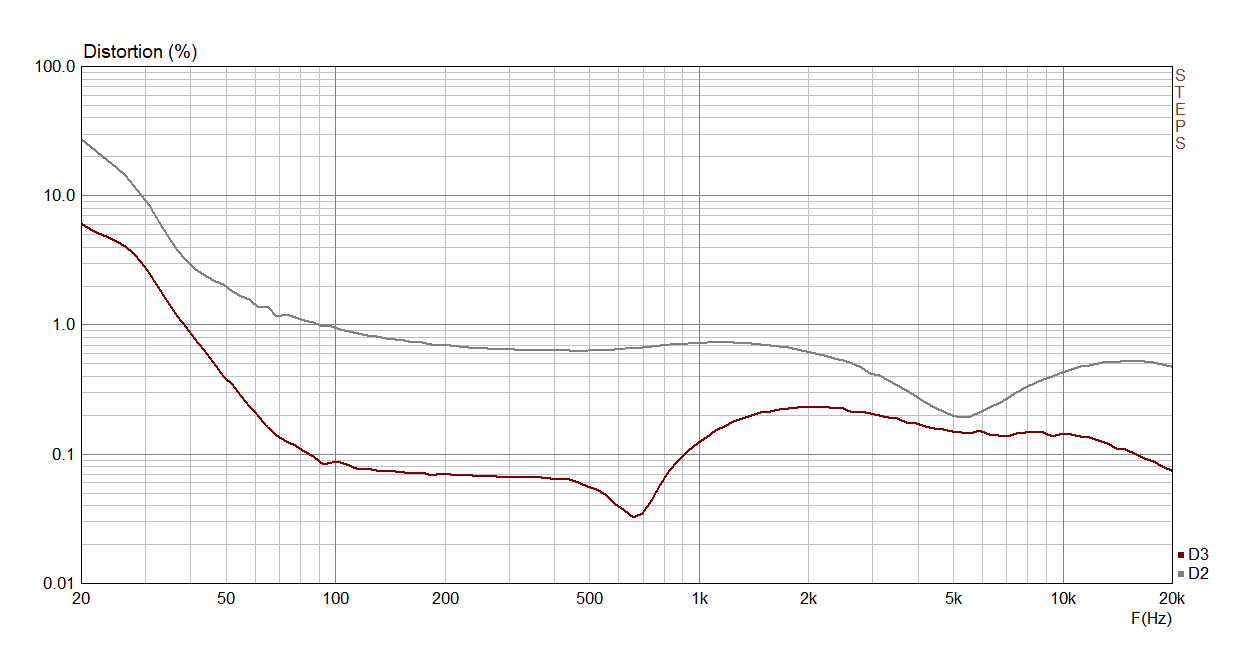
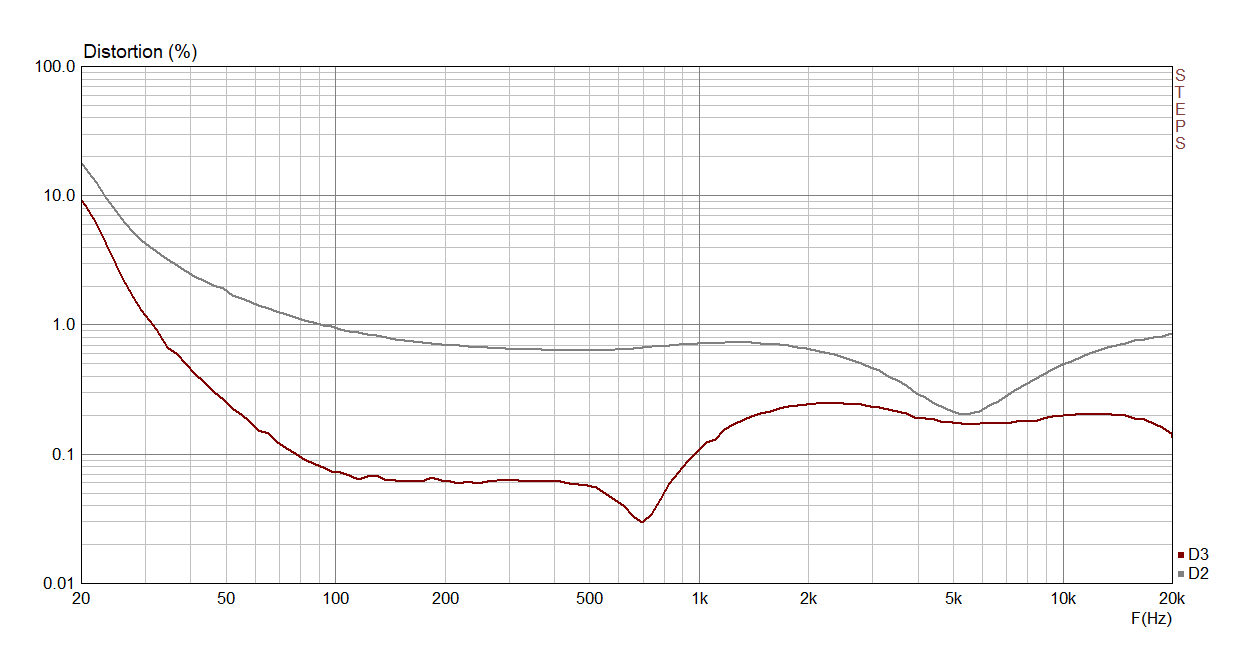
Harmonic distortion
The following plots show the second- and third-harmonic distortion components at 0.3 W output power. D2 is shown in grey and D3 in red. As expected in a single-ended output stage, the second harmonic is dominant over most of the audio band.
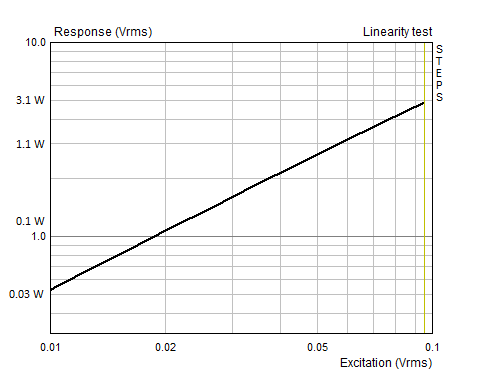
Linearity
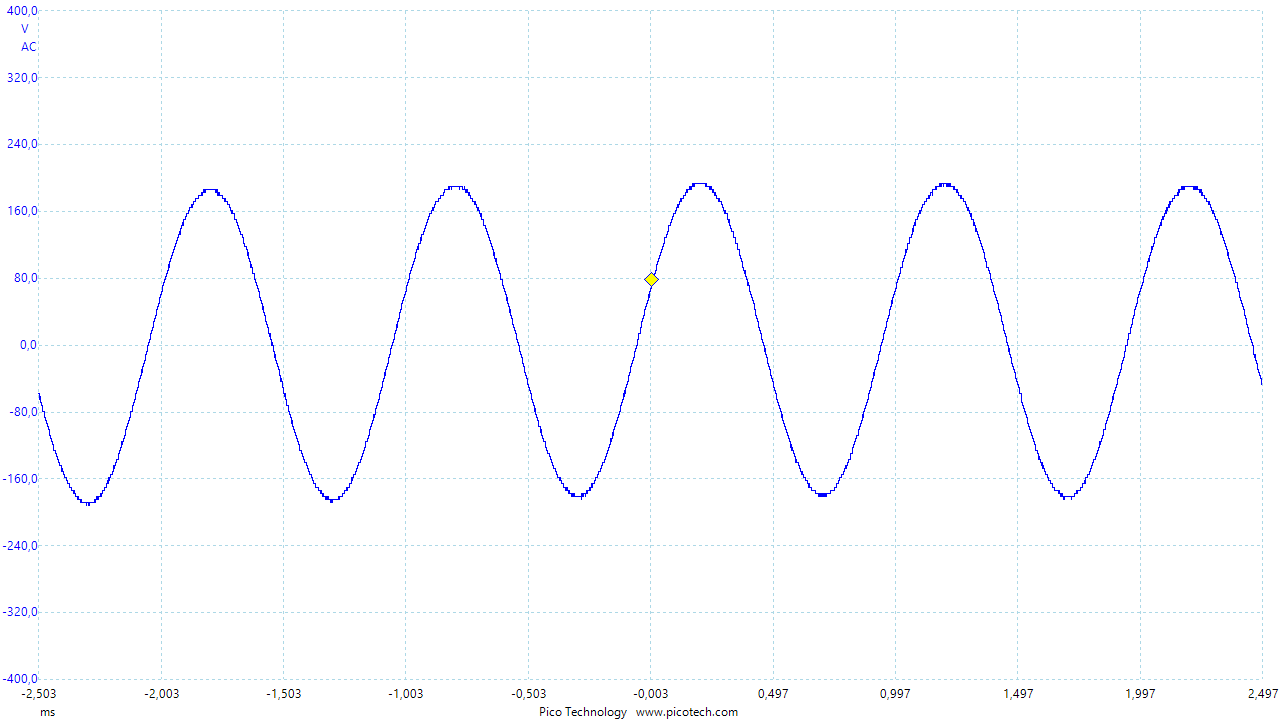
The linearity test shows the relationship between input signal level and output response before visible waveform distortion becomes significant. The measured full-output condition is reached with an input signal of 100 mV RMS at 1 kHz.
Sensitivity and voltage gain
The amplifier sensitivity, measured at 1 kHz, is 100 mV RMS for an output power of approximately 3.48 W.
With a 100 mV RMS input signal, the measured signal voltage at the EL84 anode is 132 V RMS. Assuming a 5 kΩ reflected primary load, the output power can be calculated as follows:
P = U2 / RLOAD = 1322 / 5000 = 3.48 WRMS
The voltage gain from the input to the EF86 anode is:
3.33 / 0.1 = 33.3 times, or approximately 30 dB
The voltage gain from the EF86 anode to the EL84 anode is:
132 / 3.33 = 39.6 times, or approximately 32 dB
The total voltage gain from the amplifier input to the EL84 anode is therefore:
33.3 x 39.6 = 1320 times, or approximately 62 dB
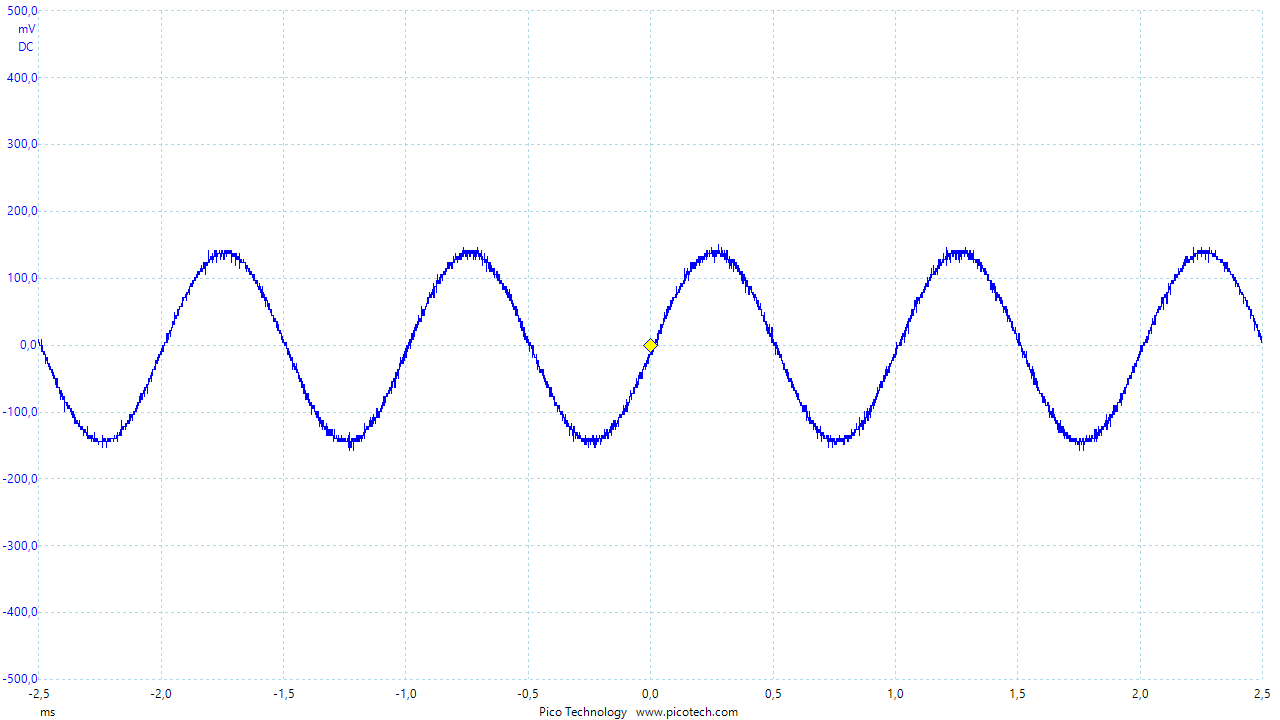
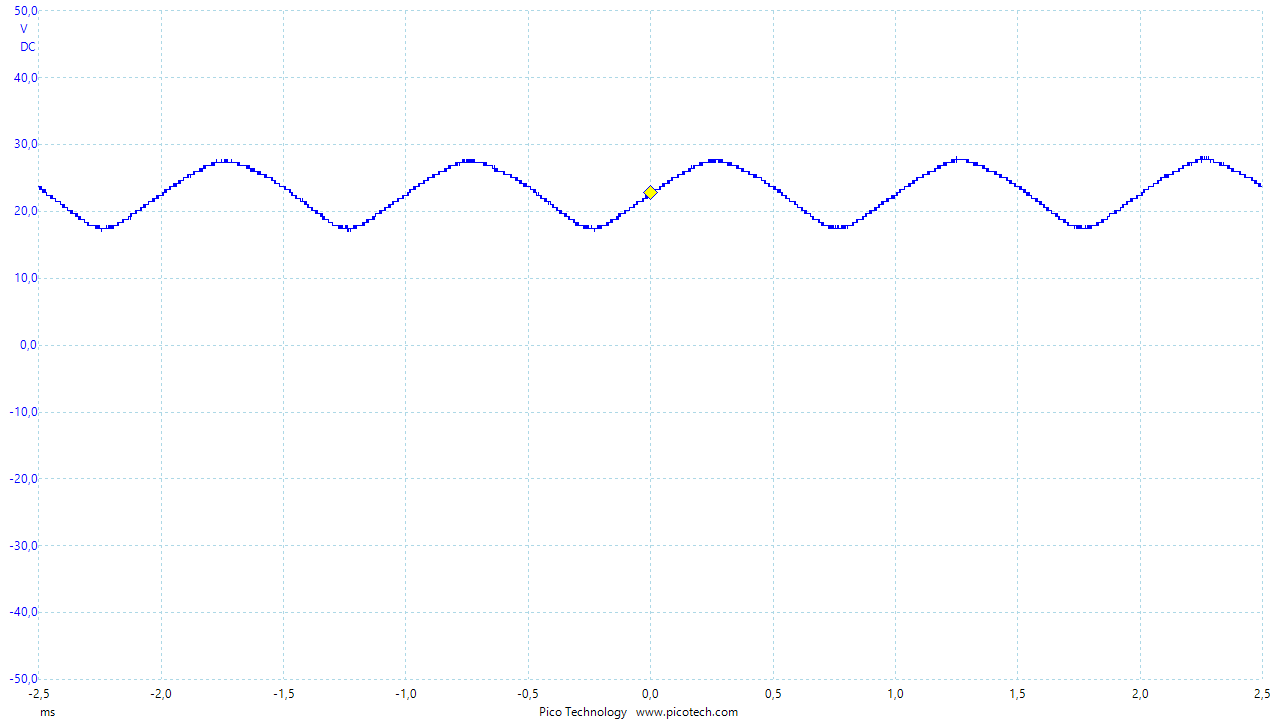
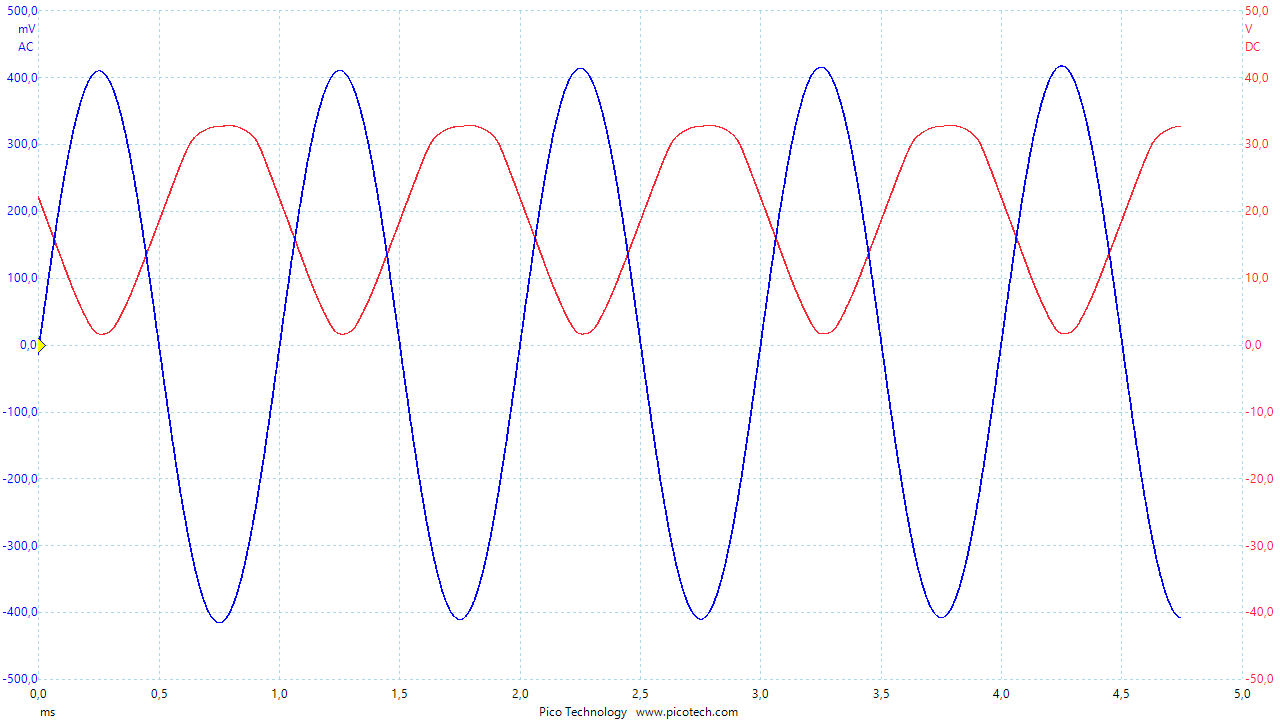
When the input signal is increased beyond 100 mV RMS, visible distortion appears at the EF86 anode, as shown in the following oscilloscope capture, where the input signal is shown in blue and the EF86 anode waveform in red.
Measurement setup
The following photograph documents the prototype measurement setup used during the characterization of the Model 1955 amplifier.