Summary. Although an output transformer has its own measured response curve, the frequency response of the complete amplifier is not determined by the transformer alone. In this design, negative feedback broadens the bandwidth and helps the finished amplifier maintain a much stronger low-frequency response than the transformer data alone might suggest.
Choice of output transformer
When I built the first prototype of the Model 1955 amplifier, I chose the Hammond Manufacturing 125BSE output transformer mainly because of its size. It is compact enough to allow both amplifier channels to fit on the same chassis, making it possible to build a stereo unit.
I checked that this transformer is rated for up to 5 watts, which is higher than the maximum undistorted output power of the amplifier, about 3 W. I also verified that the transformer is designed to handle up to 45 mA of direct current in its primary winding. This matches the quiescent current of the output stage in the Mullard 3-3 amplifier. In addition, it can be configured to present a primary load impedance of 5 kΩ, which is the recommended load for the EL84 tube when operating in single-ended mode.
Transformer response on its own
The frequency-response curve supplied by Hammond in the transformer datasheet for operation with a 5 kΩ load is shown below.
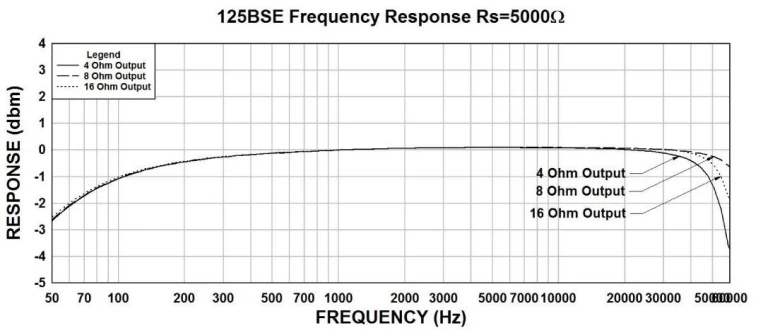
As can be seen from the graph, the output level begins to fall below about 700 Hz. The response is down by 1 dB at 100 Hz and by about 2.7 dB at 50 Hz.
Effect of negative feedback in the complete amplifier
However, regardless of these transformer data, the circuit diagram of the amplifier shows that there is a negative-feedback loop from the transformer output back to the amplifier input. This feedback network is formed by resistor R6 and capacitor C5, and it is connected to the cathode of the first amplification stage, which uses an EF86 tube. This stage effectively combines the external input signal with an inverted signal taken from the amplifier output, thereby producing negative feedback.
The advantages of negative feedback in electronic amplifiers have been well known for many years. Negative feedback reduces the overall gain of the amplifier, but in return it offers several important benefits. Voltage negative feedback improves gain stability, reduces distortion and noise, widens bandwidth, and makes the amplifier less sensitive to component tolerances and temperature variations.
For this reason, the frequency response of the complete amplifier does not necessarily have to be the same as the response of the output transformer on its own. Once negative feedback is applied, the behaviour of the whole amplifier becomes the result of the complete circuit rather than of one component taken in isolation.
Measured response of the finished amplifier
Once the amplifier had been completed and was operating correctly, I carried out several measurements to check its actual frequency response, or bandwidth. Measuring at the amplifier output, that is, after the output transformer, I obtained the following results.
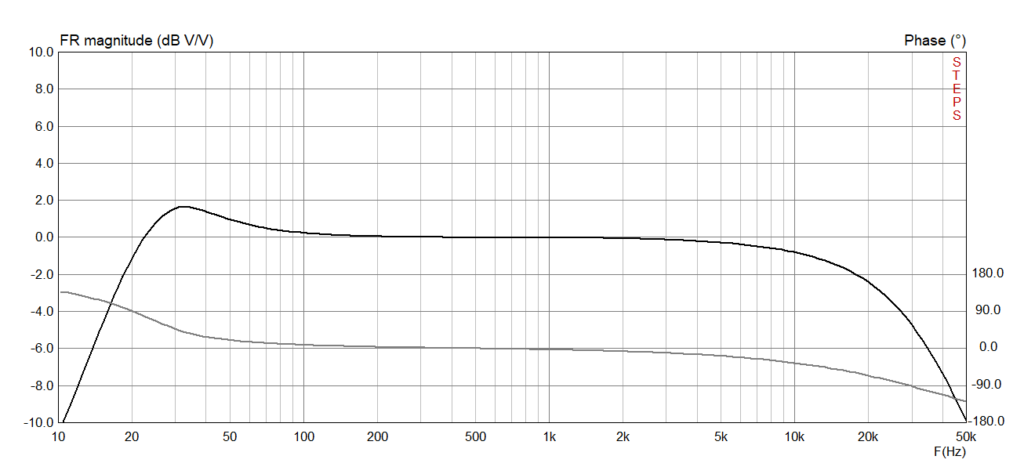
This graph shows that the response curve is no longer the same as that of the transformer by itself. Not only is there no longer a drop at low frequencies, but the low-frequency response is maintained and even shows a slight low-frequency lift. The response only starts to fall below the 0 dB line at around 25 Hz. These measurements correspond to a version of the amplifier without tone controls.
Version with tone controls
In the version that includes tone controls, the low frequencies can be increased even further. I do not have measurement results for that version, but Mullard included the following graph in the original amplifier documentation.
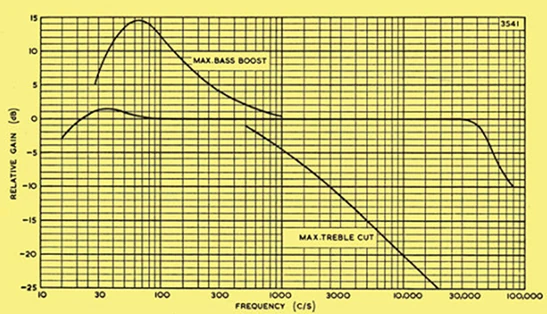
Here we can see the increase in low-frequency response that can be achieved with the bass control.
Conclusion
The Hammond 125BSE transformer is a practical and technically suitable choice for this amplifier, both in terms of size and electrical ratings. Nevertheless, its own published frequency-response curve does not fully describe the behaviour of the finished amplifier. Because the Model 1955 amplifier uses a carefully designed negative-feedback loop, the complete circuit achieves a wider effective bandwidth and a significantly improved low-frequency response. In practice, this means that the bass performance of the completed amplifier is better than the transformer data alone might suggest.